Hurricane Track Prediction
This project focuses on the problem of predicting the track of hurricanes using satellite imagery data accessed via AWS. I implement a Tensorflow multi-input, mixed type model (imagery plus numeric data) using the tf.data API to do automated feature engineering on the data pipeline.
2/28/2021 Update: I have recently returned to this project to make use of NOAA’s Big Data Project’s offerings on both AWS and GCP, which weren’t available when I started the series. Please check out the “2021 update” folder and included code / notebooks, located here. This is probably the best place to look if you’re trying to get a quick sense of how I work, but for a more extended view into the way I break broblems down and go about solving them, you should check out my YouTube series and the associated code. Much of this predates my big switch over to using Jupyter Lab / PyCharm, and I need to update much of it for TensorFlow 2.0 still, but there’s also a lot I go into here regarding the work we all have to do before we every write a line of code, such as doing research into data, what others are currently doing to solve the problem, brainstorming of new approaches, and planning of what experiemental prototypes to spend our time building. This previous work also goes into building a SQL Database, encoding massive datasets with a multidimensional autoencoder, and uses a couple very different model types types to solve the problem in different ways, such as an LSTM and a GAN.
As a quick recap from the original series, here’s the summarized version of the original problem we’re trying to solve:
- Build a hurricane prediction system with less average error (nautical miles) at 48 hours in the future than the current state of the art models (55.3 n mi). (https://www.nhc.noaa.gov/verification/pdfs/OFCL_5-yr_averages.pdf)
And here are our original design requirements:
- System must output, at a minimum, the latitude and longitude coordinate of the predicted location of the storm 48 hours from timestamp of associated input data.
- System must store track data over evaluation period for ensuring minimum performance spec is met.
- System must be trainable on my existing hardware.
- Training time must be under 5 days on existing hardware.
- Data sources must fit within budget and be readily accessible.
Regarding my new approach, you’ll find all my work in Jupyter notebooks, which are numbered in the order you should view them in. However, the first notebook is quite long as it contains everything from preprocessing to visualizing predicted hurricane tracks for the basline model, so you may need to click the link to reload it a couple times to get it to display in GitHub. Also, I don’t spend nearly as much time here going into the brainstorming and other steps I typically use to solve a problem, though those did occur behind the scenes. For that kind of detail, please check out the original YouTube series I put together. Even though that predates TensorFlow 2.0 and the NOAA Big Data Program, I still intend to roll much of that into my next iteration here.
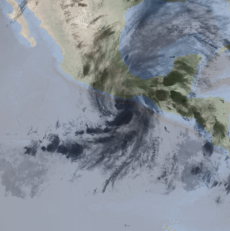 The first notebook walks through how to tie into the AWS GEOS16 satellite data, along with historic hurricane track data, to create a set of several thousand views of several hundred storms from space. I combine satellite imagery using wavelengths outside the visible spectrum to ensure we see detail at night as well as during the day, and superimpose a slightly transparent view of these storms over a terrain map of the world, so our images also show coastline and other terrain detail usually obscured by cloud cover, and all but invisible at night.
 Next, I build a model based on the wide and deep architecture which ties together the image data, along with numerical and categorical data via three separate trees, which then come together to generate forecasts of the storm’s change in latitude / longitude 48 hours in the future. The wide network also takes in bucketized, engineered versions of certain continuous variables, as well as feature crosses of bucketized latitude and longitude coordinates via Tensorflow’s feature_column class. An autogenerated representation of the baseline model is as shown to the right.
The second and third notebooks attempt to improve upon the model of the first by adding a CNN, and then using Transfer Learning with MobileNetV2. Unfortunately, the performance improvements, at least to validation error, were negligible if present at all.
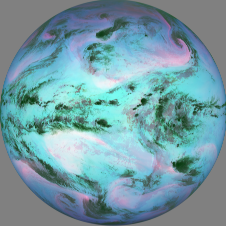 The third notebook attemps to bring in more data via the creation and use of composite full disk views of what the GOES16 satellite views across three of its bands. All three of these bands are well outside the visible spectrum, but they are used as the RGB color channels of a synthetic generated view. My thinking here was that by using channels outside the visible light spectrum, the model would see negligible differences between daytime and nighttime, which would aid in training, and but combining these channels, it would be able to discern more detail than with one band alone. Certainly looking at these images with the human eye, it’s easy to see more of the storm pattens than by looking at any single band’s image alone.
My next goal here is to revisit this general approach using alternative data sources, such as some of the derived variables output by GOES16/17, as well as the realtime composite data provided by forecasting models available in the cloud to generate similar views of the present storm, and then augment the training data with similar data from the Reanalysis 2 dataset.
If I can bring in enough historic data, I will also explore the use of LSTM / GRU versions of the image processing branches of the model.
Original Series Description
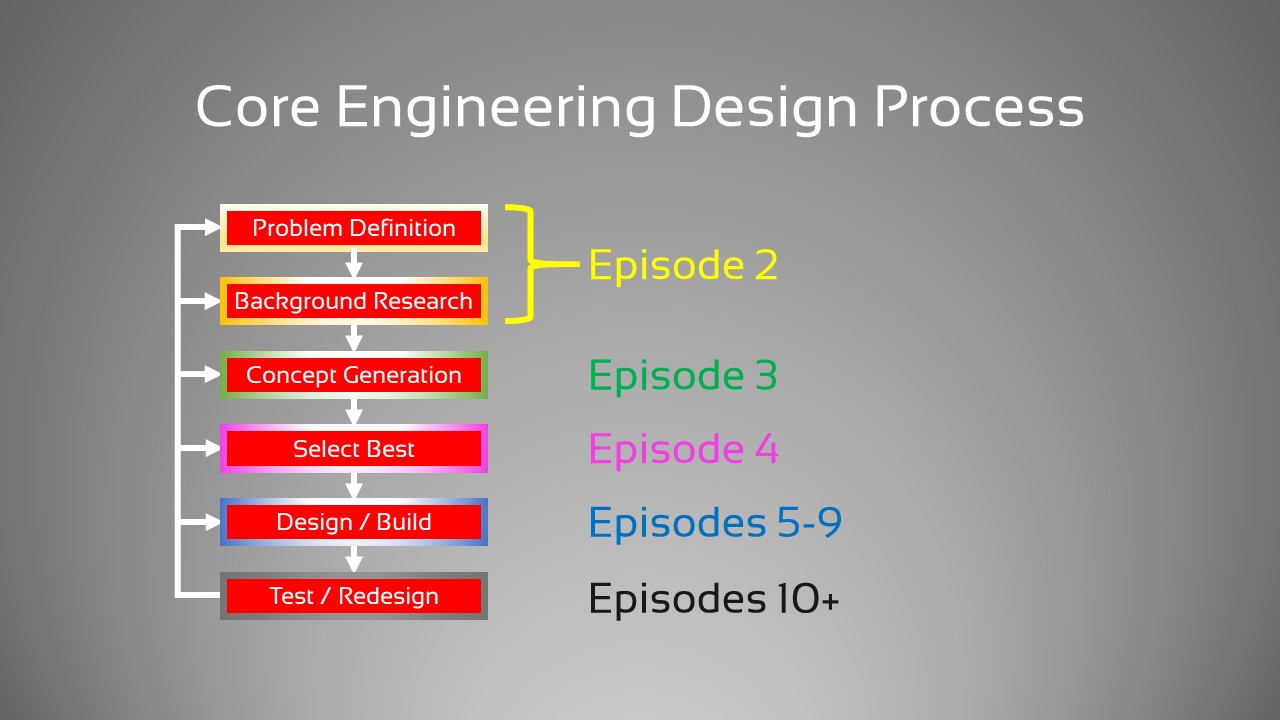
This series attempts to teach you how to use the “core engineering design process” to tackle a problem using Machine Learning and raw, uncleaned data. This process is used effectively by all disciplines of engineering, from mechanical and chemical to electrical and computer to build prototypes. The AGILE / SCRUM framework is great for improving a system that’s already in place, but for coming up with an initial design (or even a minimially viable product), nothing beats the time proven core engineering design process with good old fashioned project management techniques, like critical path analysis and resource leveling, which we’ll also briefly touch on here. Following this is how we figure out what precise problem needs to be solved, define our design requirements, research existing solutions to figure out what’s been done and how we might be able to improve it or apply it in a different way, and then design a solution that will actually solve the problem.
The series will follow the steps of the engineering design process. The result will likely be that some episodes will be longer than others, but I think this approach as a whole will convey the intent of the series better. Below are quick links to each video in the series, but to get notified of new episodes, you’ll need to subscribe via YouTube. Also, be sure to checkout the associated GitHub site: https://github.com/M00NSH0T/Hurricanes